
Understanding Candlestick Patterns
May 18, 2020
Introduction
There are many chart types used in trading, but we will focus on the Japanese candlestick charts, which have become the most popular due to their ability to ease the reading of price action. It became the most known charting technique after they were introduced to the West by Steve Nison in 1989.
Candlesticks history and definition
The Japanese began using technical analysis to trade rice in the 17th century. the guiding principles of candlesticks:
The “what” (price action) is more important than the “why” (news, earnings, and so on).
All known information is reflected in the price.
Buyers and sellers move markets based on expectations and emotions (fear and greed).
According to Steve Nison, candlestick charting first appeared sometime after 1850. Much of the credit for candlestick development and charting goes to a legendary rice trader named Homma from the town of Sakata.
On the chart, each candlestick includes an open, high, low, and close price for the timeframe. The trader sets the time frame of each candle.
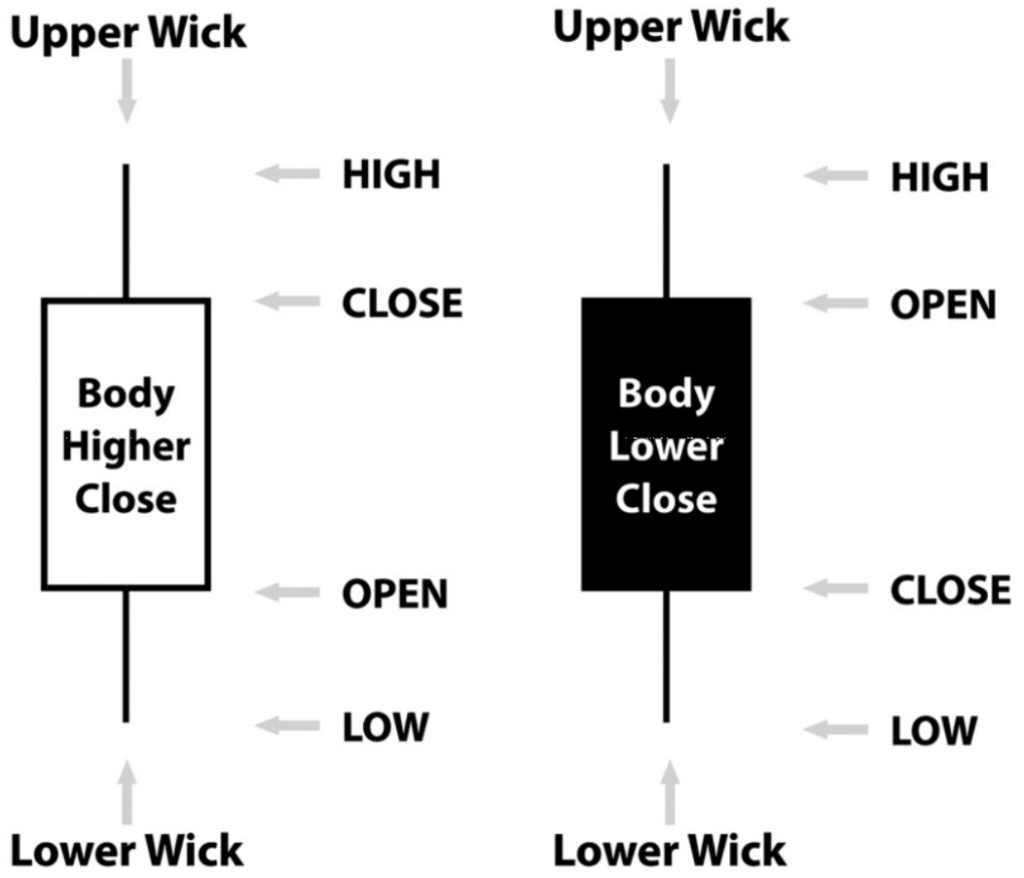
Relationship between Body and wick
The relationship between the wick and the body of a candle can identify a great deal about the market sentiment over the duration of a given candle. The longer the time the greater the importance of the candle due to the fact it entails significant information. as with many other technical indicators, candles over a shorter period of time (below h4 timeframe), are less meaningful as they are caused by random movements unrelated to any real market sentiment.
Candlestick patterns and their effects on price action
these are 4 Bullish Reversal candlestick patterns you should know:
1- Hammer
2- Bullish Engulfing Pattern
3- Piercing Pattern
4- Morning Star

1-Hammer is a (1- candle) bullish reversal pattern that forms after a decline in price.
Here’s how to recognize it:
• Little to no upper shadow
• The price closes at the top ¼ of the range
• The lower shadow is about 2 or 3 times the length of the body
And this is what a Hammer means…
1. When the market opens, the sellers took control and pushed price lower
2. At the selling climax, huge buying pressure stepped in and pushed price higher
3. The buying pressure is so strong that it closed above the opening price
In short, a hammer is a bullish reversal candlestick pattern that shows rejection of lower prices.
Now, just because you see a Hammer doesn’t mean the trend will reverse immediately.
You’ll need more “confirmation” to increase the odds of the trade working out.

2-A Bullish Engulfing Pattern is a (2-candle) bullish reversal candlestick pattern that forms after a decline in price.
Here’s how to recognize it:
• The first candle has a bearish close
• The body of the second candle completely “covers” the body of the first candle (without taking into consideration the shadow)
• The second candle closes bullish
And this is what an engulfing Pattern means:
1. On the first candle, the sellers are in control as they closed lower for the period
2. On the second candle, strong buying pressure stepped in and closed above the previous candle’s high — which tells you the buyers have won the battle for now
In essence, a Bullish Engulfing Pattern tells you the buyers have overwhelmed the sellers and are now in control.

3-A Morning Star is a (3-candle) bullish reversal candlestick pattern that forms after a decline in price.
Here’s how to recognize it:
• The first candle has a bearish close
• The second candle has a small range
• The third candle closes aggressively higher (more than 50% of the first candle)
And this is what a Morning Star means:
1. On the first candle shows, the sellers are in control as the price closes lower
2. On the second candle, there is indecision in the markets as both the selling and buying pressure are in equilibrium (that’s why the range of the candle is small)
3. On the third candle, the buyers won the battle and the price closes higher
In short, a Morning Star tells you the sellers are exhausted and the buyers are momentarily in control.

4- A Piercing Pattern is a (2-candle) reversal candlestick pattern that forms after a decline in price.
The Piercing Pattern closes within the body of the previous candle.
Thus, the Piercing Pattern isn’t as strong as the Bullish Engulfing pattern.
Here’s how to recognize it:
• The first candle has a bearish close
• The body of the second candle closes beyond the halfway mark of the first candle
• The second candle closes bullish
And this is what a Piercing Pattern means:
1. On the first candle, the sellers are in control as they closed lower for the period
2. On the second candle, buying pressure stepped in and it closed bullishly (more than 50% of the previous body) — which tells you that there is buying pressure.
These are 4 Bearish Reversal candlestick patterns you should know:
1- Shooting Star
2- Bearish Engulfing Pattern
3- Dark Cloud Cover
4- Evening Star

1-A Shooting Star is a (1- candle) bearish reversal pattern that forms after an advanced in price.
Here’s how to recognize it:
• Little to no lower shadow
• The price closes at the bottom ¼ of the range
• The upper shadow is about 2 or 3 times the length of the body
And this is what a Shooting Star means…
1. When the market opens, the buyers took control and pushed price higher
2. At the buying climax, huge selling pressure stepped in and pushed price lower
3. The selling pressure is so strong that it closed below the opening price
In short, a Shooting Star is a bearish reversal candlestick pattern that shows rejection of higher prices.

2-A Bearish Engulfing Pattern is a (2-candle) bearish reversal candlestick pattern that forms after an advanced in price.
Here’s how to recognize it:
• The first candle has a bullish close
• The body of the second candle completely “covers” the body first candle (without taking into consideration the shadow)
• The second candle closes bearish
And this is what a Bearish Engulfing Pattern means…
1. On the first candle, the buyers are in control as they closed higher for the period
2. On the second candle, strong selling pressure stepped in and closed below the previous candle’s low — which tells you the sellers have won the battle for now
In essence, a Bearish Engulfing Pattern tells you the sellers have overwhelmed the buyers and are now in control.

3-A Dark Cloud Cover is a (2-candle) reversal candlestick pattern that forms after an advanced in price.
The Dark Cloud Cover closes within the body of the previous candle.
The Dark Cloud Cover isn’t as strong as the Bearish Engulfing pattern.
Here’s how to recognize it:
• The first candle has a bullish close
• The body of the second candle closes beyond the halfway mark of the first candle
• The second candle closes bearish
And this is what a Dark Cloud Cover means…
1. On the first candle, the buyers are in control as they closed higher for the period
2. On the second candle, selling pressure stepped in and it closed bearishly (more than 50% of the previous body) — which tells you there are selling pressure around.

4-An Evening Star is a (3-candle) bearish reversal candlestick pattern that forms after an advanced in price.
Here’s how to recognize it:
• The first candle has a bullish close
• The second candle has a small range
• The third candle closes aggressively lower (more than 50% of the first candle)
And this is what an Evening Star means…
1. On the first candle, it shows the buyers are in control as the price closes higher
2. On the second candle, there is indecision in the markets as both the selling and buying pressure are in equilibrium (that’s why the range of the candle is small)
3. On the third candle, the sellers won the battle and the price closes lower
In short, an Evening Star tells you the buyers are exhausted and the sellers are momentarily in control.
And these are 2 indecision candlestick patterns you should know:
1- Spinning top
2- Doji

A spinning top is an indecision candlestick pattern that where both buying and selling pressure is fighting for control. The color of the real body is not very important.
Here’s how to recognize it:
• The candle has long upper and lower shadow
• The candle has a small body
And here’s what a Spinning top means…
When the market opens, both the buyers and sellers aggressively tried to gain control (which results in upper and lower shadows)

A Doji represents indecision in the markets as both buying and selling pressure are in equilibrium.
Here’s how to recognize it:
• The candle’s open and close are around the middle of the range
• The upper and lower shadows are short and about the same length
Conclusion
Candlestick Patterns are endless, but we found that the patterns we shared with you are the most known and the most important.
Furthermore, here is how you can read any candlestick pattern like a pro.
Here’s what you must know…
1. The color of the body tells you who’s in control
2. The length of the wick represents price rejection
3. The ratio of the body to the wick tells you the “whole story”.
More about this in the next article.
Candles offer you vital information; you can use that information to hypothesize who is currently in control.
Moreover, with the combination of other technical indicators, the probability of success will be much higher.