
What is Sentiment Analysis? and How Does it Work?
December 8, 2020
Fundamental and technical analysis are very popular subjects in trading. However, sentiment analysis is a subject not tackled by many and it’s becoming quite popular due to the expansion of technology.
So, What is Sentiment Market Analysis?
Market sentiment analysis is a technique that can complement fundamental, quantitative, and technical analysis. Sentiment analysis is also one of the more successful methods of including the effects of market psychology in a trading strategy. Empirical evidence suggests that investor sentiment is one of the most reliable indicators of future price movements, due to the fact that most markets are driven by supply and demand factors.

How emotions affect the market??
Traders and investors are usually driven by one form of psychological need or another. The fear of missing out, for example, can make people invest in assets that have no value. one of the examples I will give is something called crypto kitties, when bitcoin was making its rise and people started investing in it, we saw also the creation of many products based on cryptocurrency that were selling even if they had no value whatsoever.
So, in that case, people are not buying these assets because it will make them money but because they need to avoid the feeling of missing out. In a recession or in a bear market you notice investors selling stocks below their value because they need to stop feeling the pain of losing money.
Here are quite a few indicators and metrics that can be used to give us a good idea of how participants view the outlook for markets.
1. The VIX index
One of the most well-known is the VIX Index which is an index that records the implied volatility of S&P 500 index options. For those that are not familiar with options, they are financial instruments that investor uses whenever they see the need to protect themselves when the market is volatile. And since the VIX records that volatility, it is known as the “Fear Index” because it gives a good indication of the amount of fear in the market.
2. “Risk on” assets
Investors move to safe-haven assets when they are risk-averse, and to riskier assets when sentiment is positive. This is known as the “risk-on / risk-off trade”.
“Risk on” assets include emerging market currencies, debt and equities, high yield and junk bonds, and small-cap stocks.
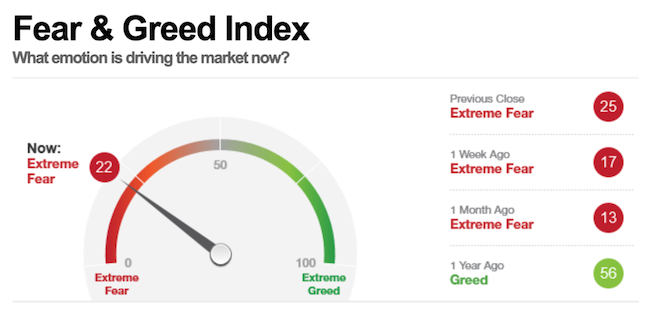
3. CNN’s Fear and Green Index
This index combines 7 different sentiment indicators to produce a reading between 1 and 100, with 1 indicating extreme fear and 100 indicating extreme greed. The indicators it uses include all those listed above, as well as market momentum.
4. The high/low Index
The High / Low index is a ratio of stocks making new 52-week highs vs those making new 52-week lows. A reading below 30 implies bearish sentiment, while a reading above 70 implies bullish market sentiment.
How to utilize sentiment analysis for trading?
The largest price moves happen when sentiment changes quickly, and when a large group of market participants switch from bullish to bearish or vice versa. The most profitable opportunities, therefore, exist when the conditions for rapidly changing sentiment are in place.
The ideal way of using sentiment analysis is to combine it with technical and fundamental. Often than not, you see the fundamental is not agreeing with the change of sentiments, and on the short term, sentiment analysis would be the winner.Be surewhatever side you choose in that particular instance, to have a clear risk management strategy, and to never enter any trade on stocks or any instruments, without a stoploss.
Join our community and learn how to trade
during every market condition.
www.RichTL.com