
Top 5 Cryptocurrencies to Trade Now: Price Action Analysis!
September 12, 2022
Hello everyone, this is Richard, a.k.a theSignalyst and in this article we are going to focus on 5 Cryptocurrencies that I am keeping an eye on lately.
Grab a coffee or tea, sit back and enjoy it 😀
First, let’s start with a quick market overview.
Crypto Market Overview
Most altcoins have been stuck inside a range, slightly bullish, for the past couple of weeks, following BTC price action.
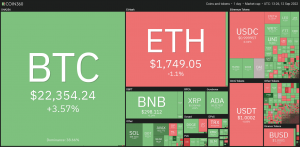
Cryptocurrency Market Heatmap | Source: Coin360
Fear and Greed Index Signals “Extreme Fear”, Bulls Looming to Buy
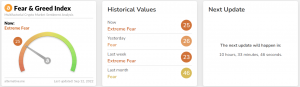
Fear & Greed Index | Source: Alternative
Extreme Fear to me is a signal to “look” for buy setups. As the old famous saying: “the time to buy is when there’s blood in the streets.” ~ Nathan Rothschild
But of course, it wouldn’t be wise to jump in blindly in a bearish market. Instead, we will be waiting for the bulls to take over.
1- LUNC (LUNC/USDT) Analysis
LUNC is overall bullish trading above our brown trendline acting as a non-horizontal support.
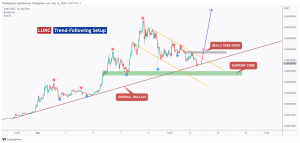
LUNC/USDT Chart on the Daily Timeframe | Source: KuCoin
Since LUNC is sitting around our brown trendline, we will be looking for trend-following buy setups.
on H1: LUNC formed a valid trendline in orange but it is not ready to go yet.
Trigger => for the bulls to take over, we need a momentum candle close above the last high in gray.
We would be overall bullish , unless the bears manage to break below the green support zone .
2- Stellar (XLM/USDT) Analysis
The picture is self-explanatory.
XLM/USDT Chart on the Daily Timeframe | Source: KuCoin
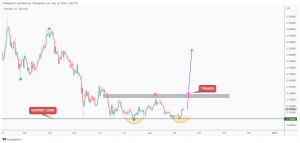
XLM rejected our green support 0.1 and now forming a double bottom pattern.
The double bottom would be an idea, until XLM breaks above its gray neckline. In this case a movement higher would be expected.
Meanwhile, until the buyers take over, XLM would be overall bearish.
3- Kucoin (KCS/USDT) Analysis
KCS is sitting around the 10.0 support zone so we will be looking for buy setups.
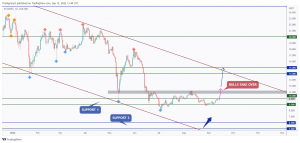
KCS/USDT Chart on the Weekly & Daily Timeframe | Source: KuCoin
For the bulls to take over, we need a momentum daily candle close above the gray zone.
Meanwhile, KCS would be overall bearish and can still trade lower.
4- Algorand (ALGO/USDT) Analysis
ALGO is sitting around a strong support and demand zone so we will be looking for buy setups on lower timeframes.
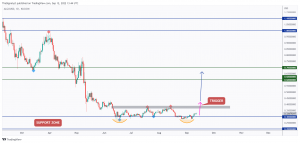
ALGO/USDT Chart on the Daily Timeframe | Source: KuCoin
ALGO is also forming a double bottom.
Trigger => Waiting for a momentum candle close above the gray neckline to buy.
Meanwhile, until the buy is activated, ALGO can still trade lower inside the blue green zone. In this case, we will be looking for buy setups on lower timeframes.
5- Chainlink (LINK/USDT) Analysis
LINK is approaching support in green, so we will be looking for buy setups.
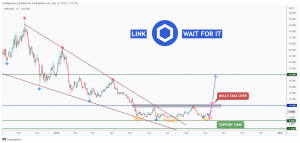
LINK/USDT Chart on the Daily Timeframe | Source: KuCoin
LINK also formed an inverse head and shoulders pattern and we are waiting for a momentum candle close above the gray neckline to buy.
Meanwhile, until the buy is activated, LINK would be overall bearish can still trade lower inside the horizontal support in green.
Did you know that KuCoin offers premium TradingView charts to all its clients? With this, you can step up your Bitcoin technical analysis and easily identify various crypto chart patterns.
On Kucoin, you can trade 700+ Crypto Assets, including the 8 coins mentioned in this article.
Find the next crypto gem on KuCoin!For every 4 crypto holders in the world, there’s 1 from KuCoin cryptocurrency exchange!
Register and trade via my referral link to enjoy 20% discount on trading fees!
https://www.kucoin.com/r/af/QBSSSCAT
There are also mystery gifts, VIP perks, fan-only benefits, and other bonuses waiting for you!
Hope you find this article useful.
“All Strategies Are Good; If Managed Properly!”
~Richard Nasr