
Top 8 Cryptocurrencies to Trade Now: Price Action Analysis!
August 25, 2022
Hello everyone, this is Richard, a.k.a theSignalyst and in this article we are going to focus on 8 Cryptocurrencies that I am keeping an eye on lately and that are forming a very similar pattern.
First, let’s start with a quick market overview.
Crypto Market Overview
Most altcoins have been stuck inside a range, slightly bullish, for the past couple of weeks, following BTC price action.
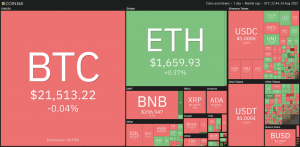 Cryptocurrency Market Heatmap | Source: Coin360
Fear and Greed Index Signals “Extreme Fear”, Bulls Looming to Buy
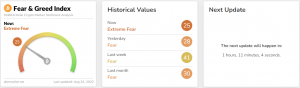 Fear & Greed Index | Source: Alternative
Extreme Fear to me is a signal to “look” for buy setups. As the old famous saying: “the time to buy is when there’s blood in the streets.” ~ Nathan Rothschild
But of course, it wouldn’t be wise to jump in blindly in a bearish market. Instead, we will be waiting for the bulls to take over.
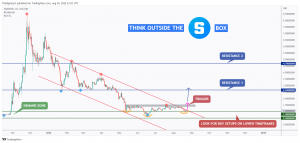
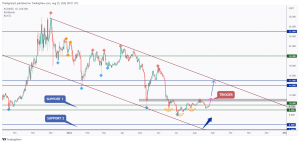
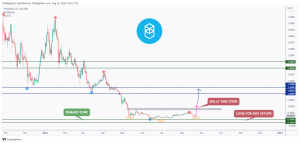
1- The SandBox (SAND/USDT) Analysis
We are overall bearish from a long-term perspective trading inside the big red channel.
 SAND/USDT Chart on the Daily Timeframe | Source: KuCoin
However, we are currently sitting around a strong demand zone, 0.5 – 1.0 so we will be looking for buy setups.
SAND is formed an inverse head and shoulders pattern but it is not ready to go yet.
For the bulls to take over, we need a daily candle close above the gray neckline.
Meanwhile, until the buy setup is activated, SAND can still dive inside the green support. In this case, we will be looking for buy setups on lower timeframes.
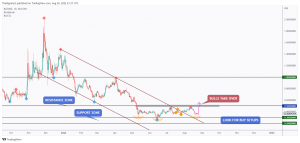
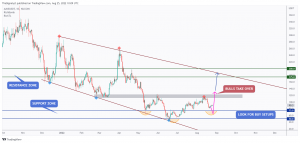
2- Near Protocol (NEAR/USDT) Analysis
The picture is self-explanatory.
 NEAR/USDT Chart on the Daily Timeframe | Source: KuCoin
NEAR rejected our green resistance 5.0 – 6.0 and now forming an inverse head and shoulders pattern.
The inverse head and shoulders would be an idea, until NEAR breaks above its gray neckline. In this case a movement higher till the next resistance in blue would be expected.
Meanwhile, until the buyers take over, NEAR would be overall bearish and can still test the blue support. In this case, we will be looking for buy setups on lower timeframes.
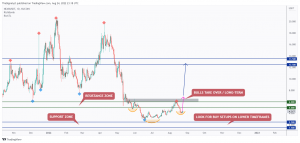
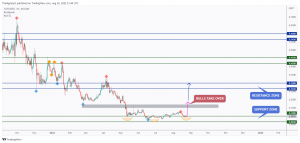
3- Kucoin (KCS/USDT) Analysis
KCS is sitting around the 10.0 support zone so we will be looking for buy setups.
 KCS/USDT Chart on the Weekly & Daily Timeframe | Source: KuCoin
For the bulls to take over, we need a momentum daily candle close above the gray neckline of the inverse head and shoulders.
Meanwhile, KCS would be overall bearish and can still trade lower.
4- Basic Attention Token (BAT/USDT) Analysis
BAT is approaching a strong support and demand zone so we will be looking for buy setups on lower timeframes.
 BAT/USDT Chart on the Daily Timeframe | Source: KuCoin
BAT is also forming an inverse head and shoulders.
Trigger => Waiting for a momentum candle close above the gray neckline to buy.
Meanwhile, until the buy is activated, BAT can still trade lower inside the blue green zone. In this case, we will be looking for buy setups on lower timeframes.
5- COTI (COTI/USDT) Analysis
COTI is approaching a support zone so we will be looking for buy setups on lower timeframes.
 COTI/USDT Chart on the Daily Timeframe | Source: KuCoin
Just like the previous altcoins highlighted in this article, COTI is forming an inverse head and shoulders.
Trigger => Waiting for the right shoulders to form then buy after a momentum candle close above the gray neckline.
Meanwhile, until the buy is activated, COTI can still trade lower inside the support. In this case, we will be looking for buy setups on lower timeframes.
6- Chainlink (LINK/USDT) Analysis
LINK is approaching support in green, so we will be looking for buy setups.
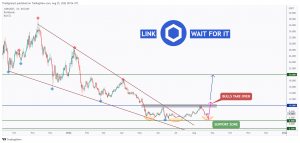 LINK/USDT Chart on the Daily Timeframe | Source: KuCoin
LINK also formed an inverse head and shoulders pattern and we are waiting for a momentum candle close above the gray neckline to buy.
Meanwhile, until the buy is activated, LINK would be overall bearish can still trade lower inside the horizontal support in green.
7- Fantom (FTM/USDT) Analysis
FTM is approaching support in green, so we will be looking for buy setups.
 FTM/USDT Chart on the Daily Timeframe | Source: KuCoin
Just like the previous 6 altcoins, FTM is forming an inverse head and shoulders pattern and we are waiting for a momentum candle close above the gray neckline to buy.
Meanwhile, we will be looking for buy setups on lower timeframes as Fantom approaches the green support zone.
8- AAVE (AAVE/USDT) Analysis
AAVE is approaching support in green, so we will be looking for buy setups.
 AAVE/USDT Chart on the Daily Timeframe | Source: KuCoin
AAVE also formed an inverse head and shoulders pattern and we are waiting for a momentum candle close above the gray neckline to buy.
Meanwhile, until the buy is activated, AAVE would be overall bearish can still trade lower inside the horizontal support in blue.
Did you know that KuCoin offers premium TradingView charts to all its clients? With this, you can step up your Bitcoin technical analysis and easily identify various crypto chart patterns.
On Kucoin, you can trade 700+ Crypto Assets, including the 8 coins mentioned in this article.
Create an account through the below link:
For 20% discount on trading fees
https://www.kucoin.com/r/af/QBSSS9G4
Hope you find this article useful.
“All Strategies Are Good; If Managed Properly!”
~Richard Nasr