
How to trade 123 Pattern; Objectively
July 23, 2020
RichTL 123 Pattern is simply an objective 123 Patterns. No second guessing, no pattern forcing, no subjectivity, no… no… no… you got my point!
Before we go over our RichTL 123 Pattern. What is a 123 pattern?
The 1-2-3 pattern is one of the most popular trading patterns. We can say that it is the bottom, a correction, a re-test, and a rebound. The pattern usually occurs at the end of trends and swings, and they are an indication of a change in trend. They can also be found within a trading range, and they take place when the directional momentum of a trend is diminishing
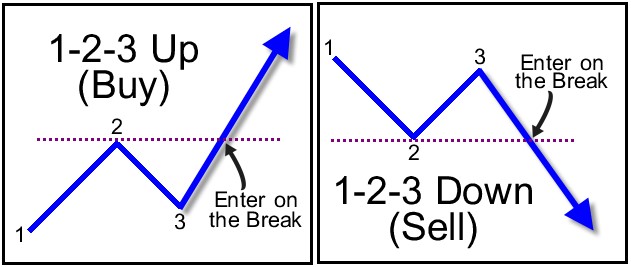
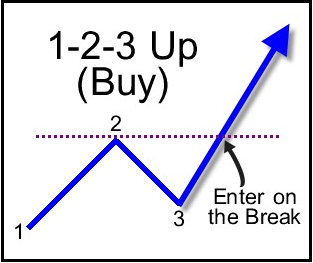
Uptrend:
– Point 1 is the lowest low point, forms a support level.
– Point 2 will be the peak, or the highest point, forms a resistance level.
– Point 3 will be the second low point, a support level (must be higher than point 1 which is the lowest low point)
The price breakout above point 2 signals the continuation of the uptrend.
Downtrend:
– Point 1 becomes the highest peak when price finds resistance and moves down.
– Point 2 becomes the lowest low point, forms support.
– Point 3 forms when the price moves up and forms a resistance.
The price breakout below point 2 support level indicates that the market is most likely to continue going south in a downtrend.
RichTL 123 Pattern is objective as we will be using RichTL dots to identify our 123 levels.
123 Pattern is a reversal pattern, and just like any pattern it occurs at the end of trends. So only look for such pattern in a trending market, no ranging ones.
Let us get started…
As previously mentioned, before we start looking for pattern, we need to identify a trend.
For example, below we have got a bullish trend on CADCHF as was price making higher highs and higher lows.
Big Impulse movements in purple
Small corrective movements in orange
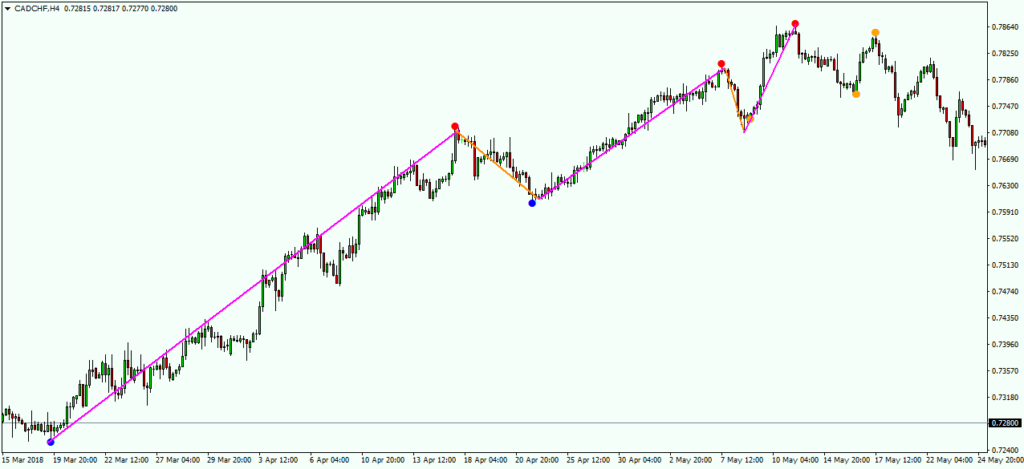
Then price made a higher low (in blue) but couldn’t make a higher high (in red), forming a 123 pattern as you can see in the picture below.
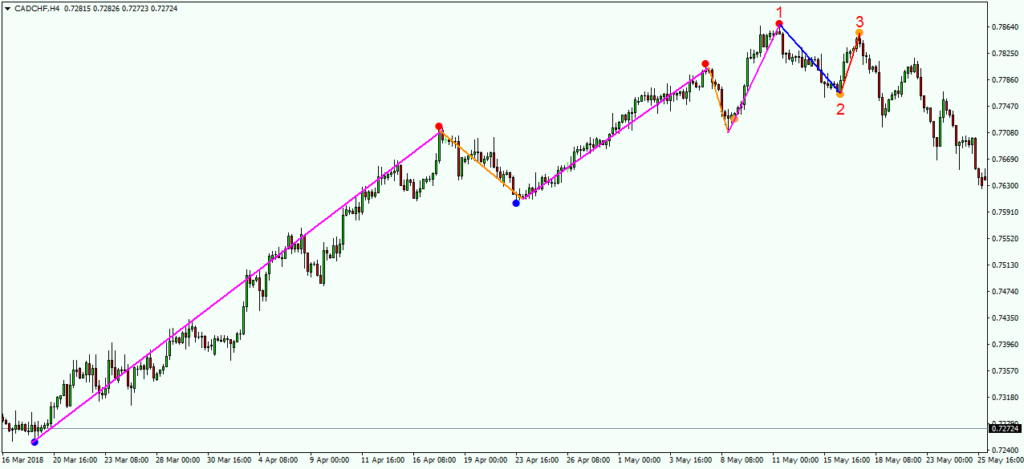
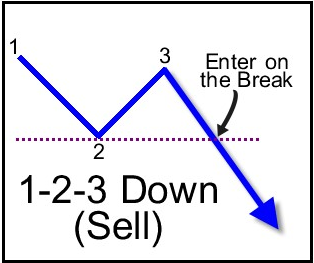
Here is the pattern again as shown in the first picture
How do we trade this pattern?
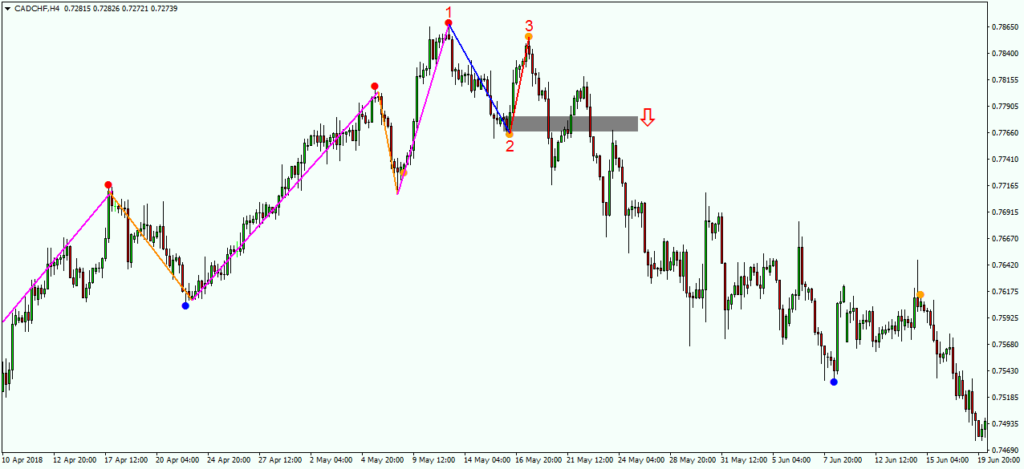
We simply draw a line/zone at level 2 and enter on a momentum candle close below it as you can see in the picture above.
Confluence
As I always say, our strategies are not stand-alone systems. Extra confirmation is always needed. The more the confluences, the better.
Let us go over our previous example and check if we have any confluences confirming our setup.
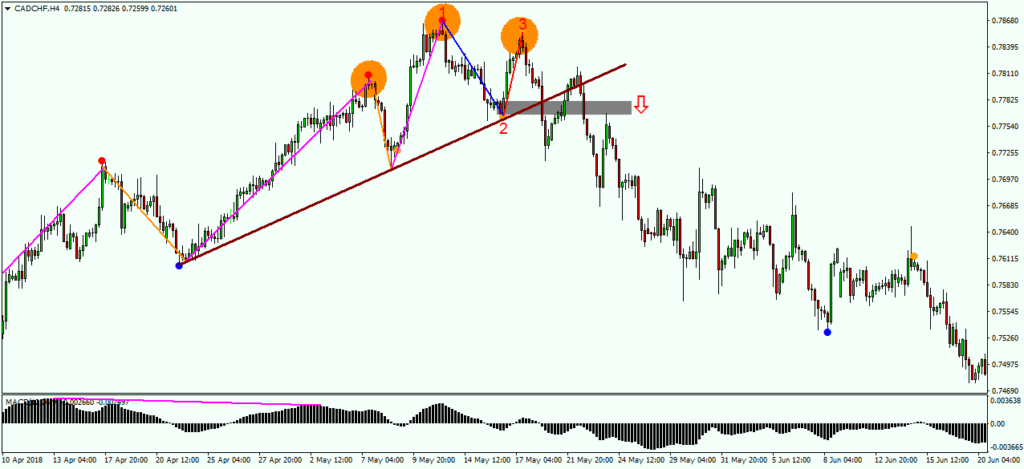
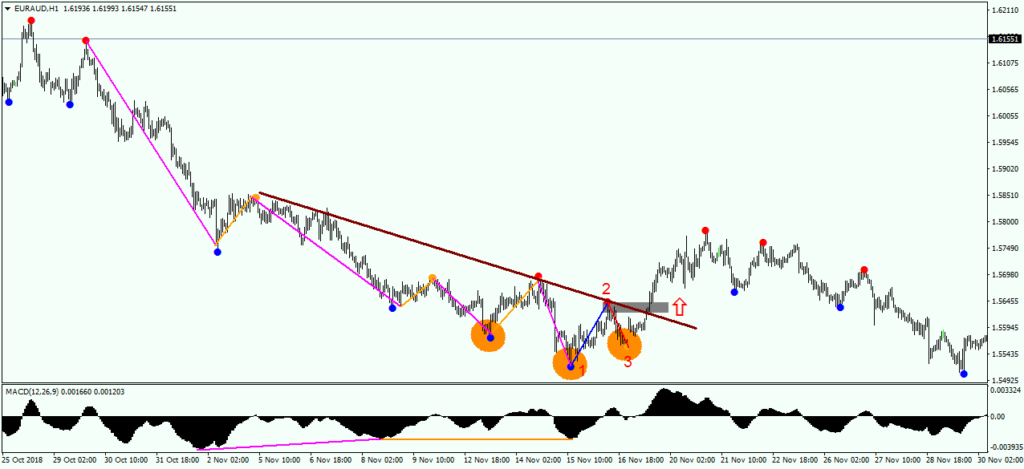
1- Head and Shoulders in orange ellipses
2- Divergence in Purple on MACD
3- Objective trendline in Maroon, which also acts as our Head and Shoulders neckline
Let us go over a bullish 123 Pattern example
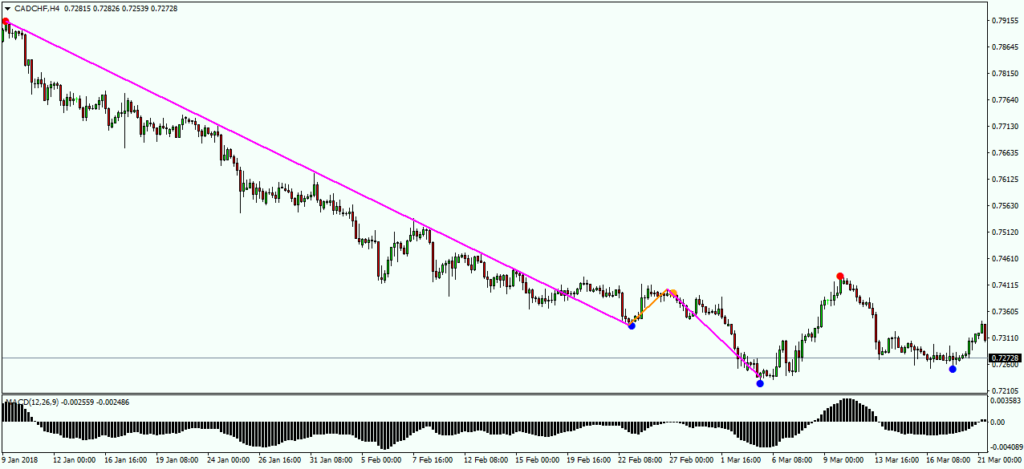
Below we have got a bearish trend on CADCHF as price was making lower highs and lower lows.
Big Impulse movements in purple
Small corrective movements in orange
Then price made a higher high (in blue) this time breaking the previous high giving us an early alert that the bulls are gaining strength.
But couldn’t make a lower low (in red), forming a 123 pattern as you can see in the picture below.
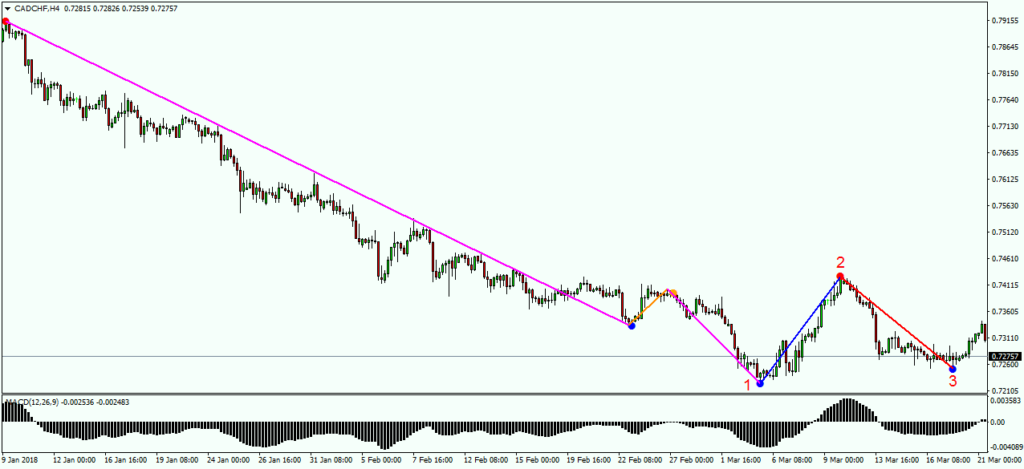
Here is the pattern again as shown in the first picture
How do we trade this pattern?
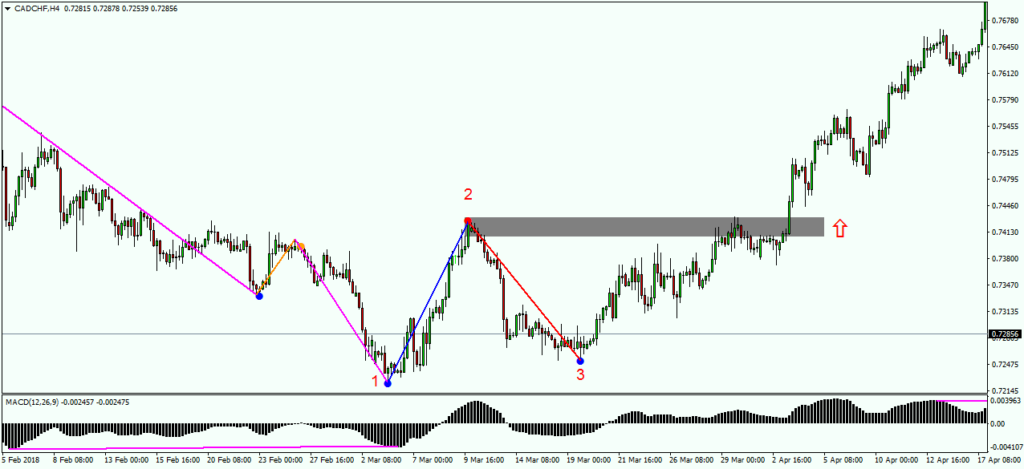
We simply draw a line/zone at level 2 and enter on a momentum candle close above it as you can see in the picture above.
Here we have got a divergence on MACD in purple as a confluence.
More examples:
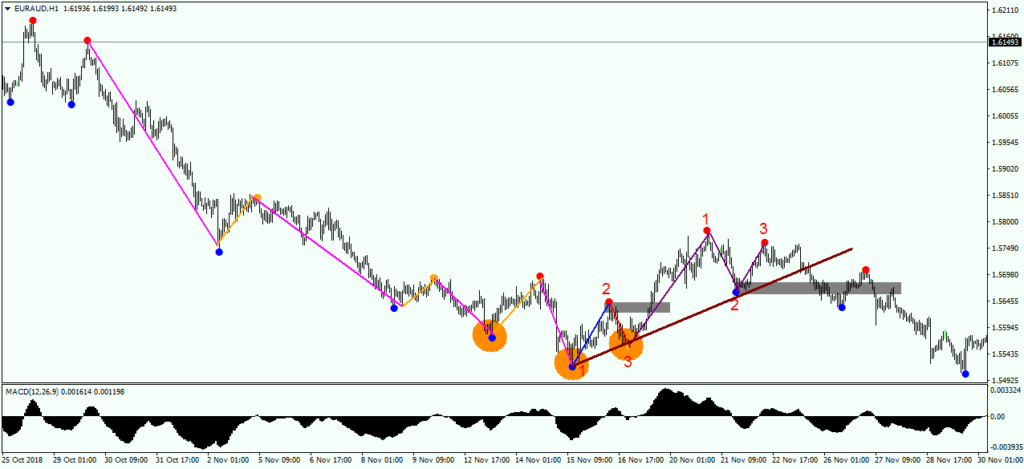
EURAUD H1
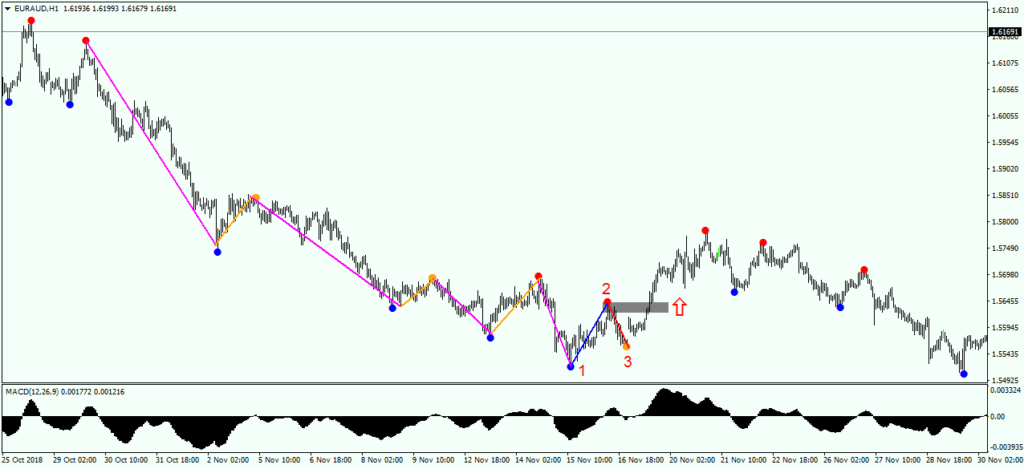
How about confluences? The picture says it all
I can see another 123 pattern here on EURAUD H1
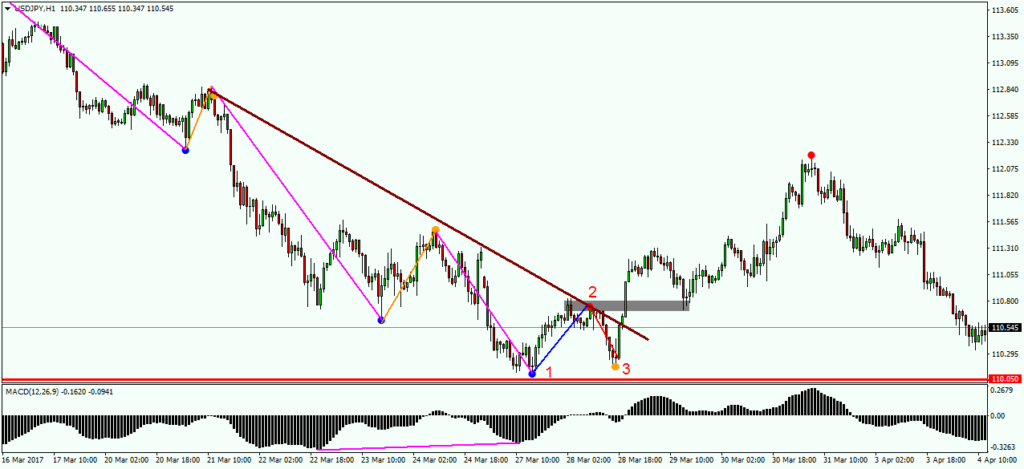
here is one more on USDJPY
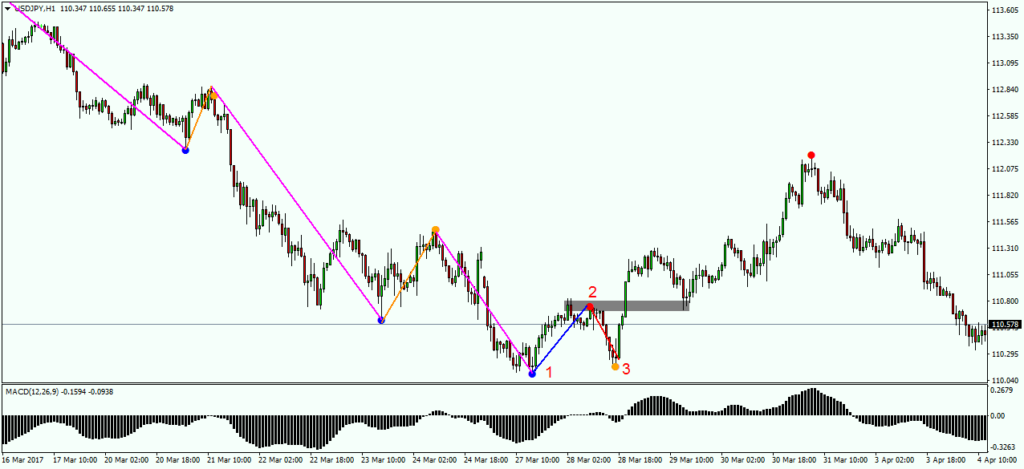
how about confluences? The picture says it all
All Strategies are good; if managed properly!
~Richard Nasr
Join our community and learn how to spot
patterns in a rule-based way.
www.RichTL.com